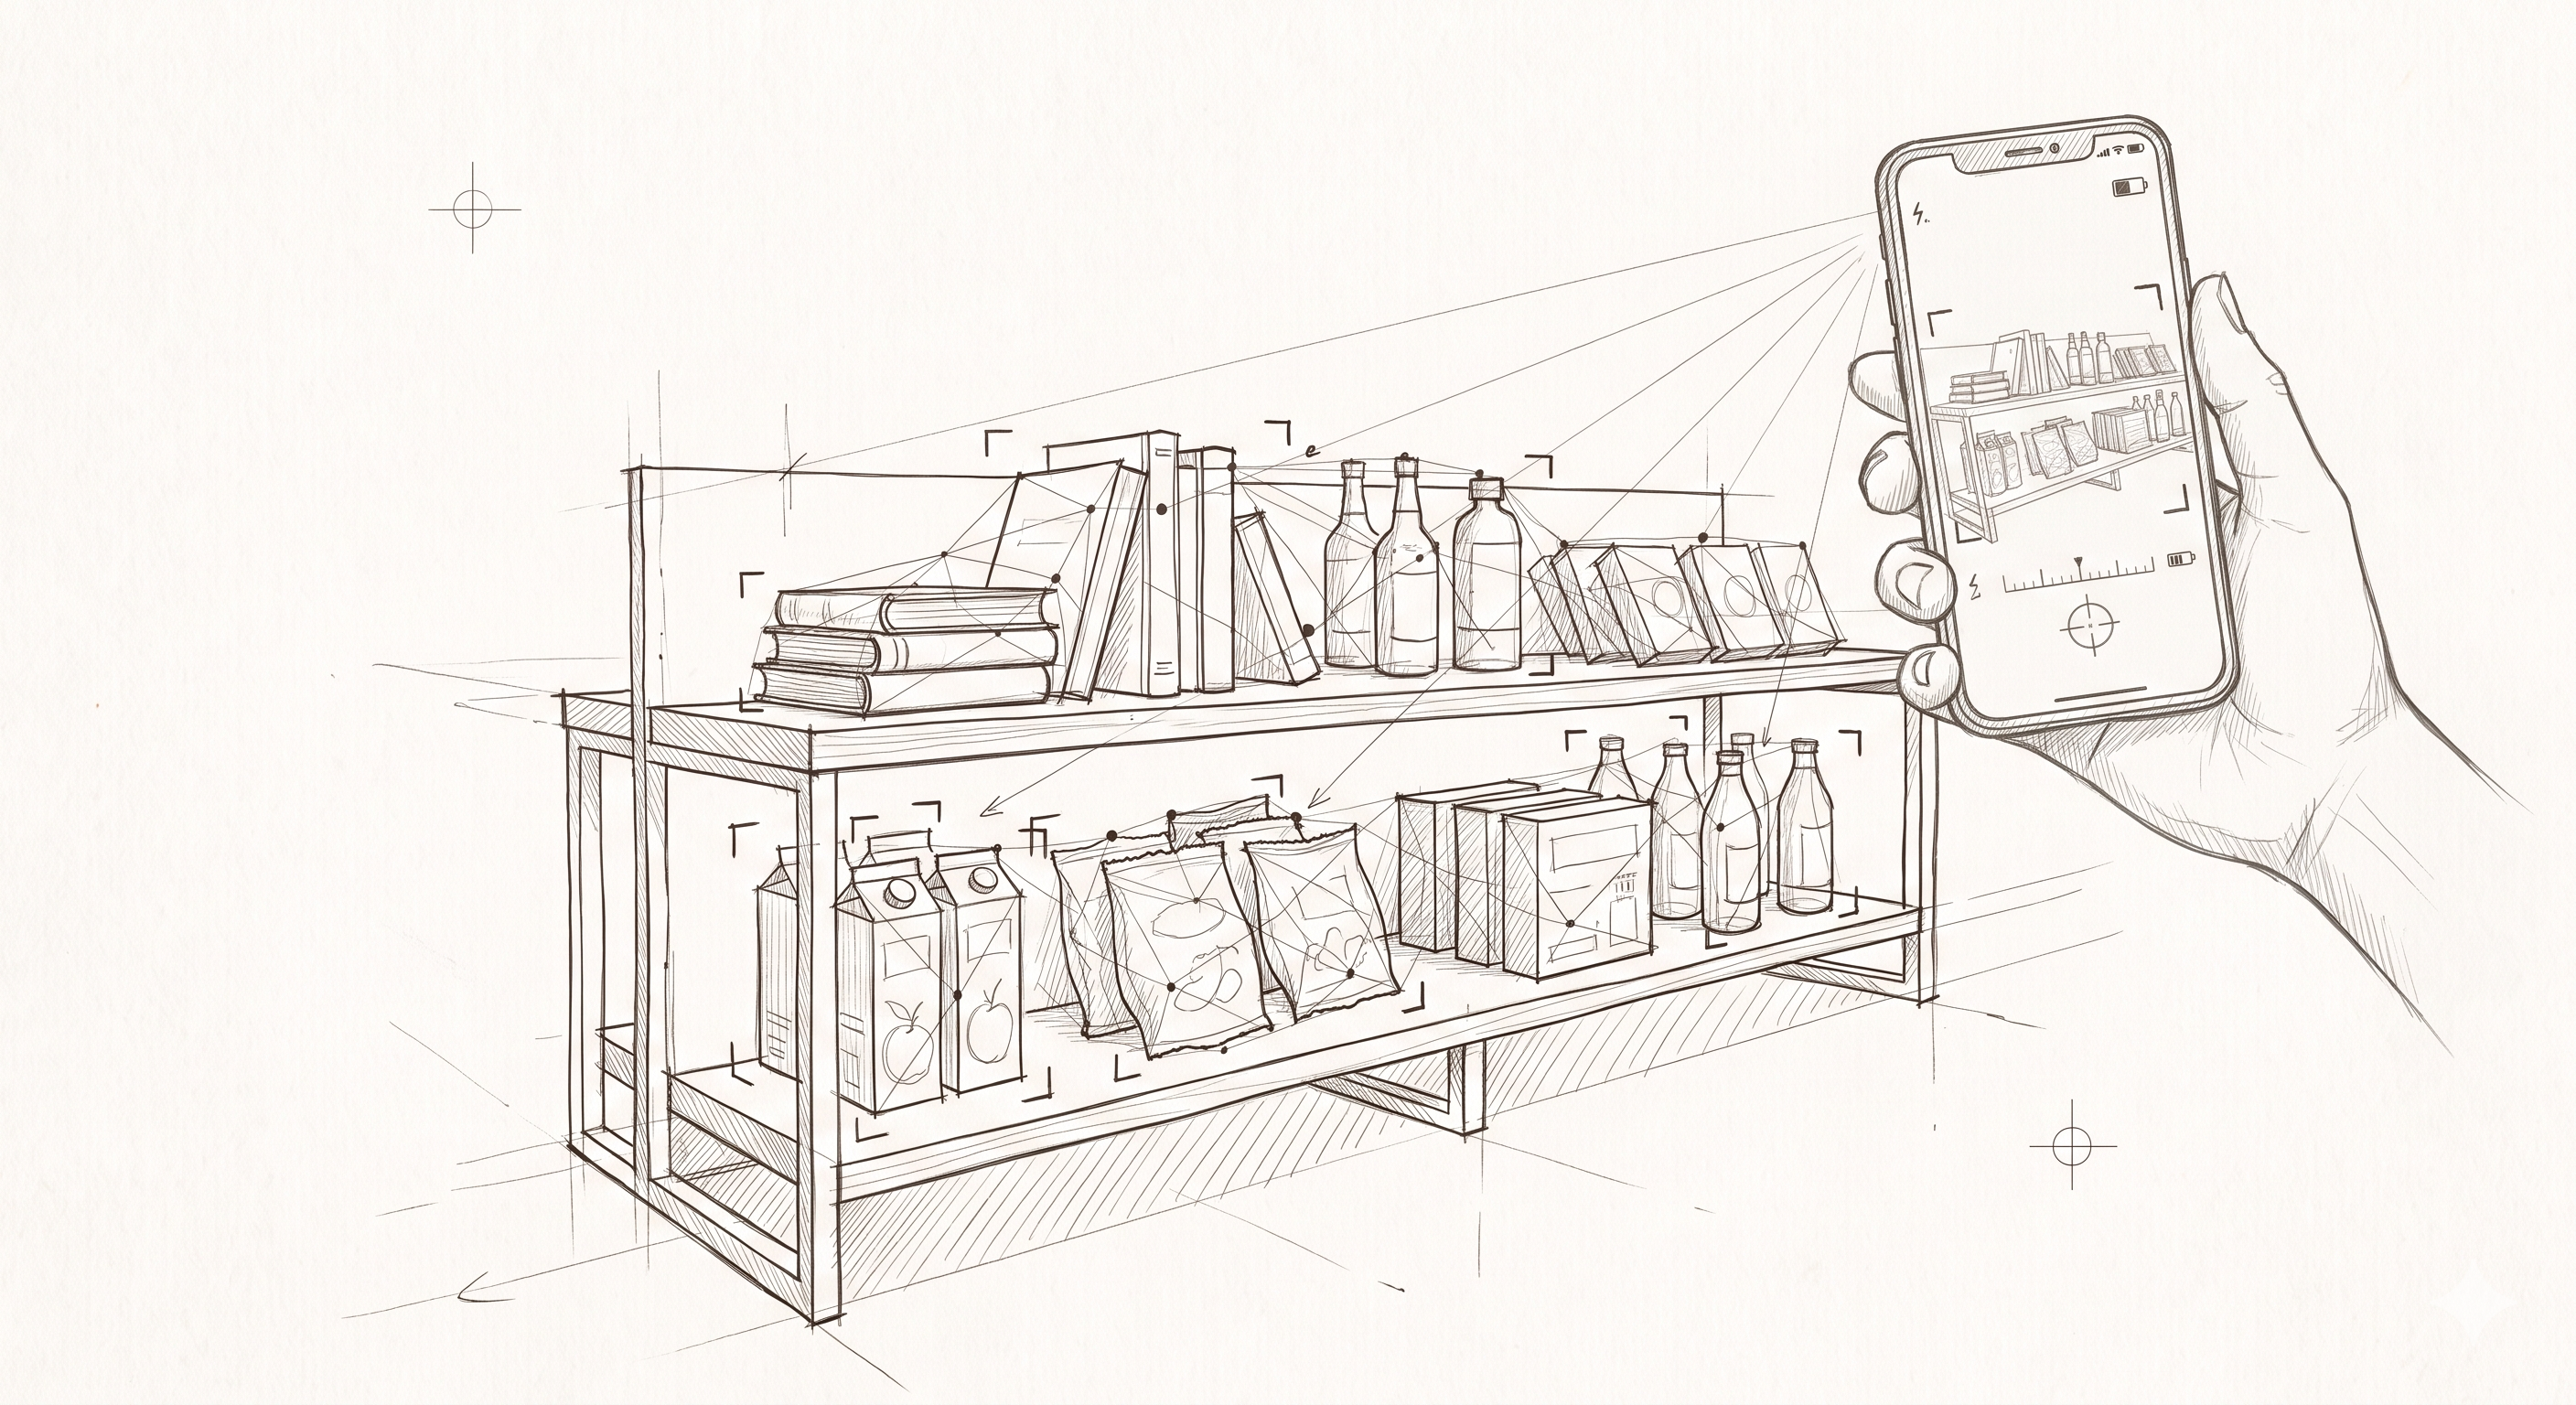
Audit the physical world from a single photo.
ASAI Labs builds computer-vision protocoling and auditing for FMCG operations - bakeries, gas stations, retail shelves and beyond. Your team snaps a photo; our custom vision models return verified, structured data in seconds.

Trusted by FMCG operators across Europe





- 200+
- Locations under management
- 0M+
- Photos processed
- 3
- Countries served
01/Where it works
One platform, every FMCG floor
The same vision pipeline audits any physical retail surface. We tune a custom model per vertical - bakeries are our flagship, with more rolling out across the field.
Bakeries
Track fill ratios across display cases and baskets, flag sell-outs, and cut end-of-day waste - our most mature, custom-trained model.
Gas stations & forecourts
Audit forecourt stock, cooler facings, and convenience-shelf availability across every site from one dashboard.
Retail & grocery
Shelf availability, planogram compliance, and out-of-stock detection from a single staff photo.
Convenience stores
Real-time counter and cooler inventory without a single manual count.
Pharmacies
Verify shelf compliance and stock levels for regulated, fast-moving SKUs.
Your vertical next
If it lives on a shelf, counter, or forecourt, we can train a model for it. Tell us what you need to audit.
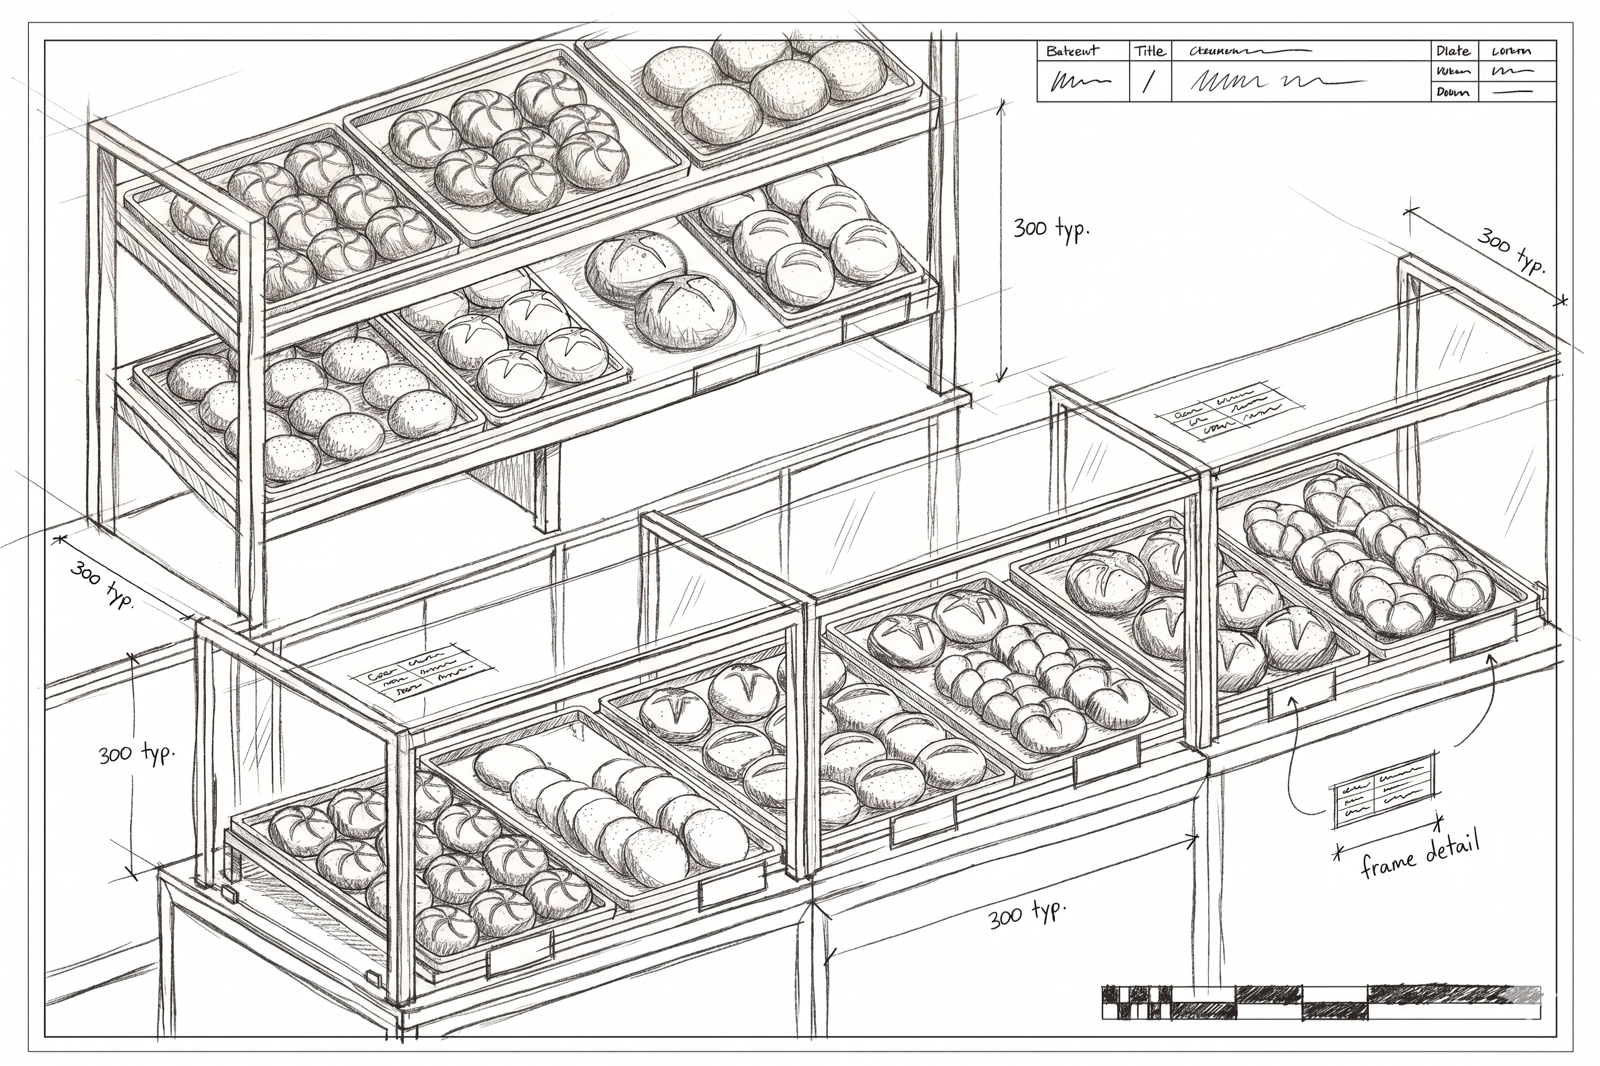
Flagship use case/Bakeries
Tired of empty display cases?
Stop letting missed sales cut into your margins.
Here is exactly how an ASAI Labs deployment works on a bakery floor.
02/The Process
How It Works
From a shop-floor photo to live dashboard data - in seconds.
Step 1
Step 1
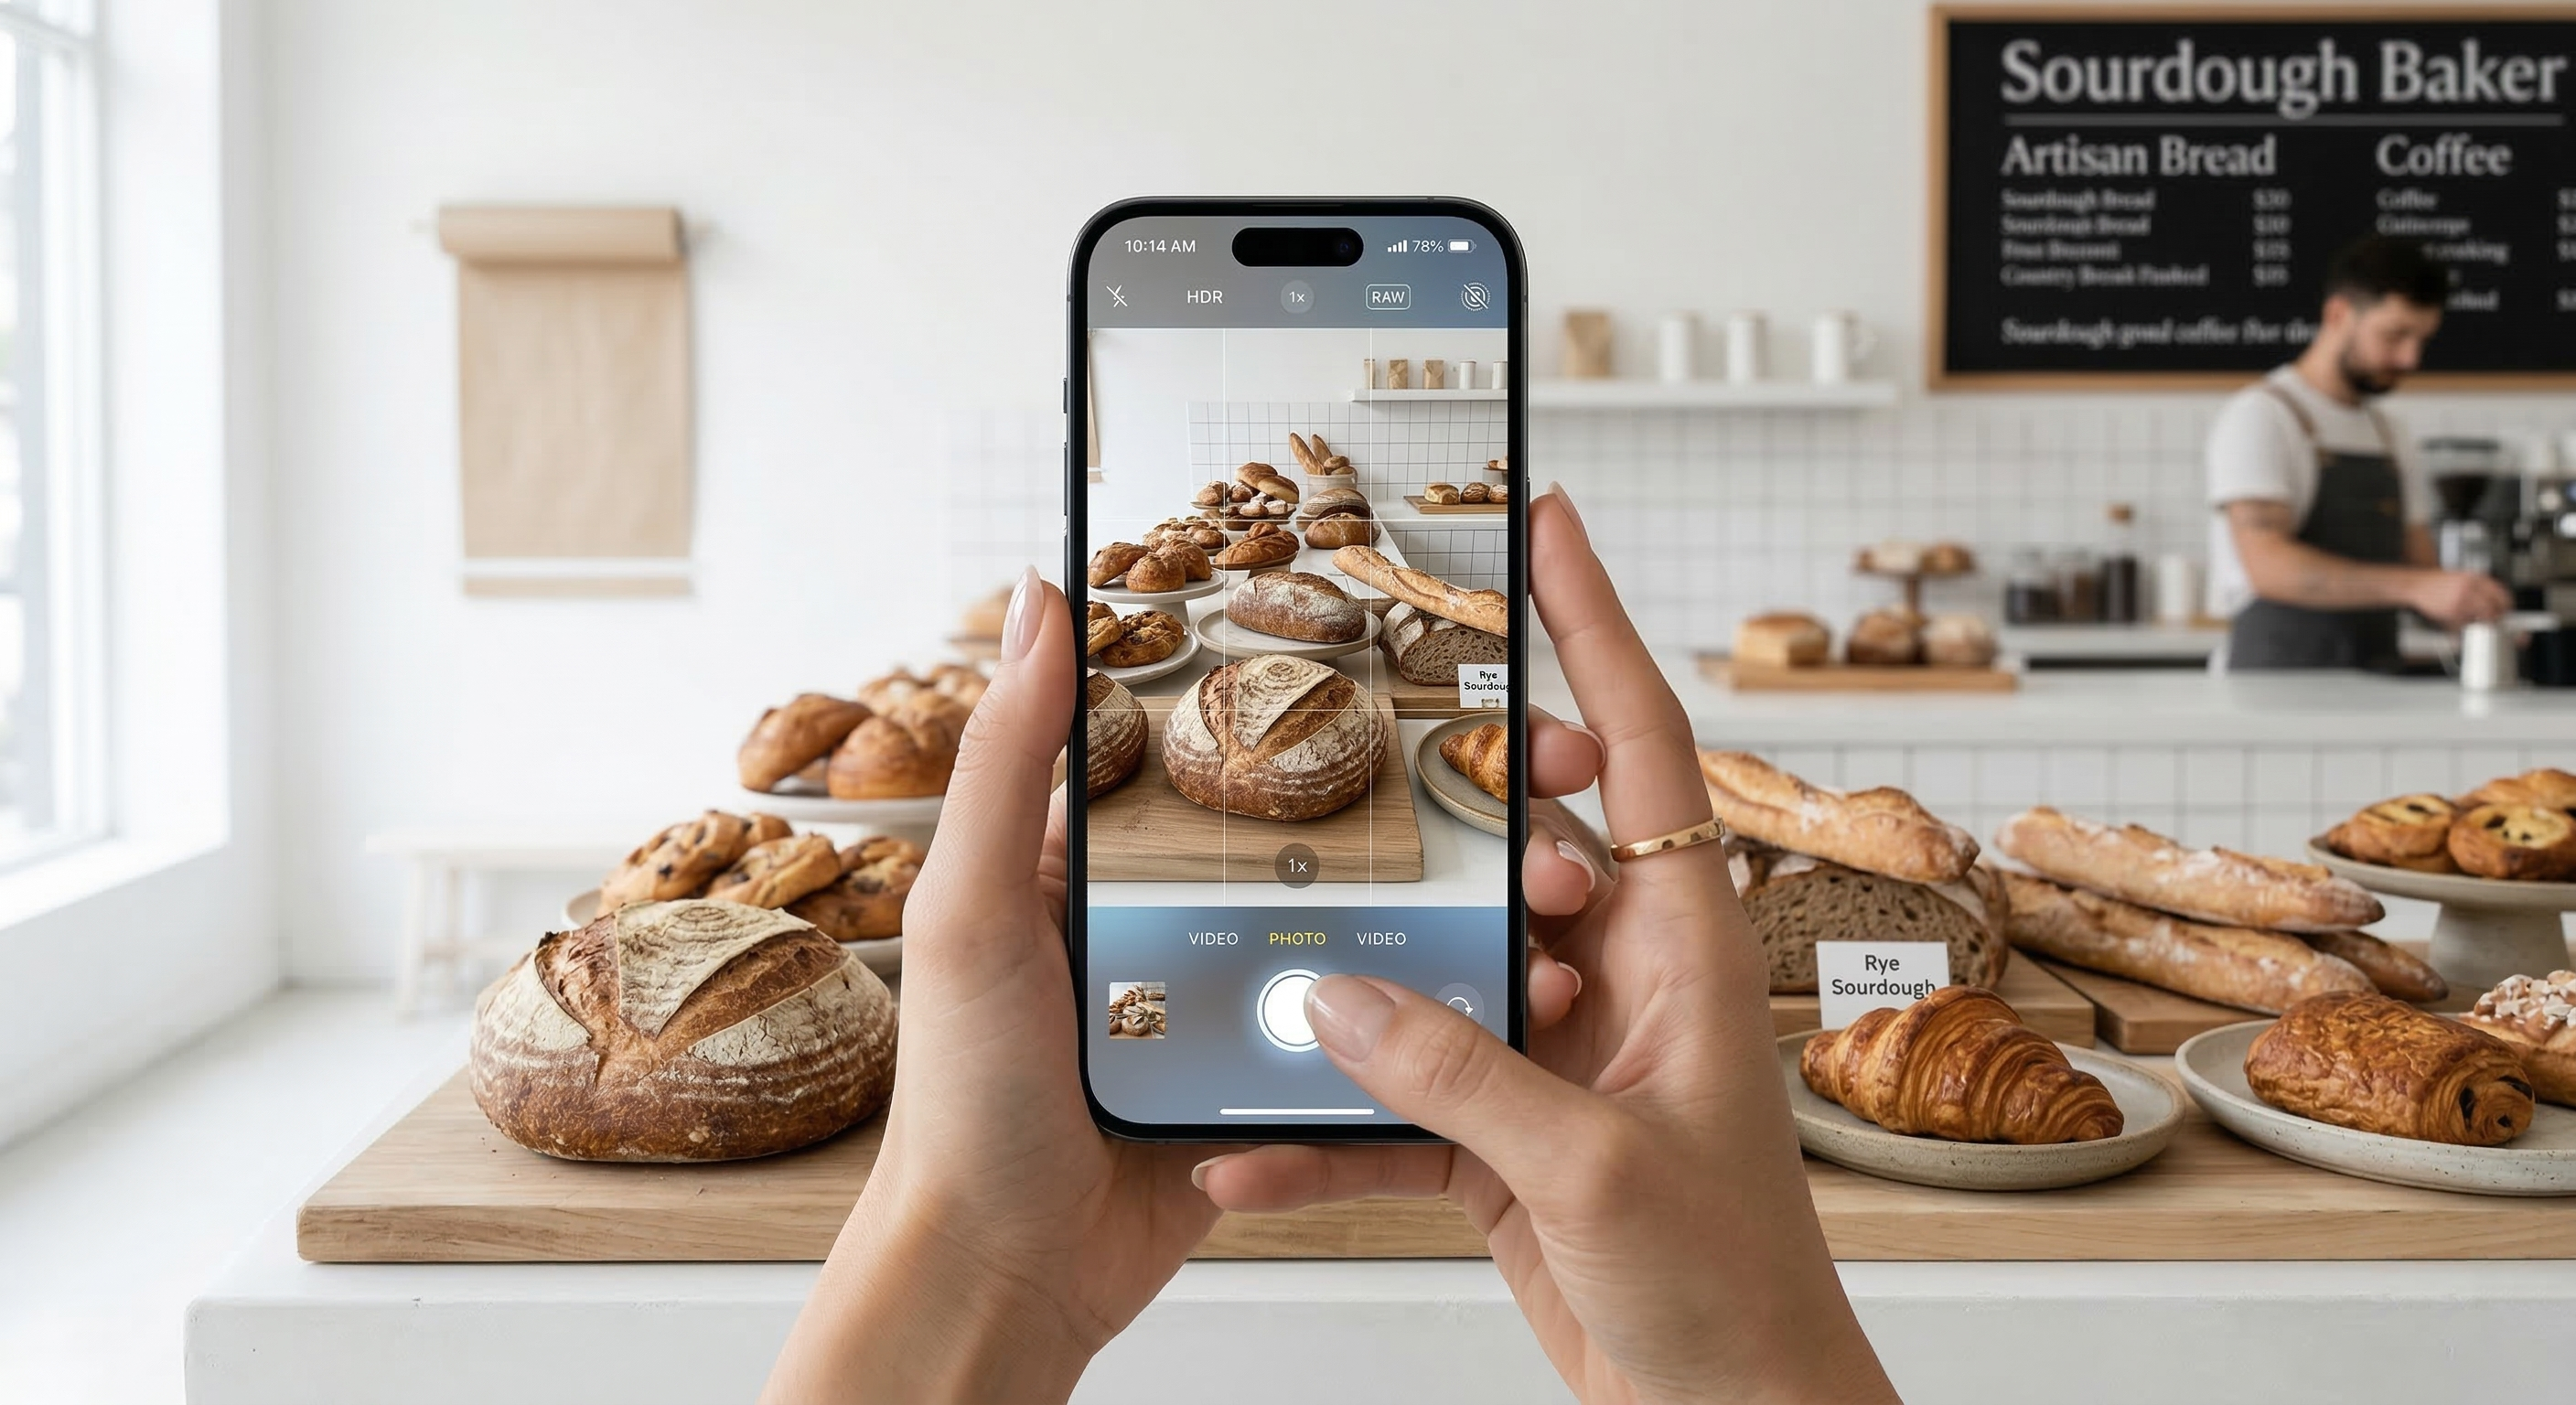
Snap a quick photo
Your staff receives a gentle notification to take a picture of the display cases. No complex hardware installations or clunky scanning wands are required - just a quick photo using any smartphone or tablet.
Step 2
Step 2
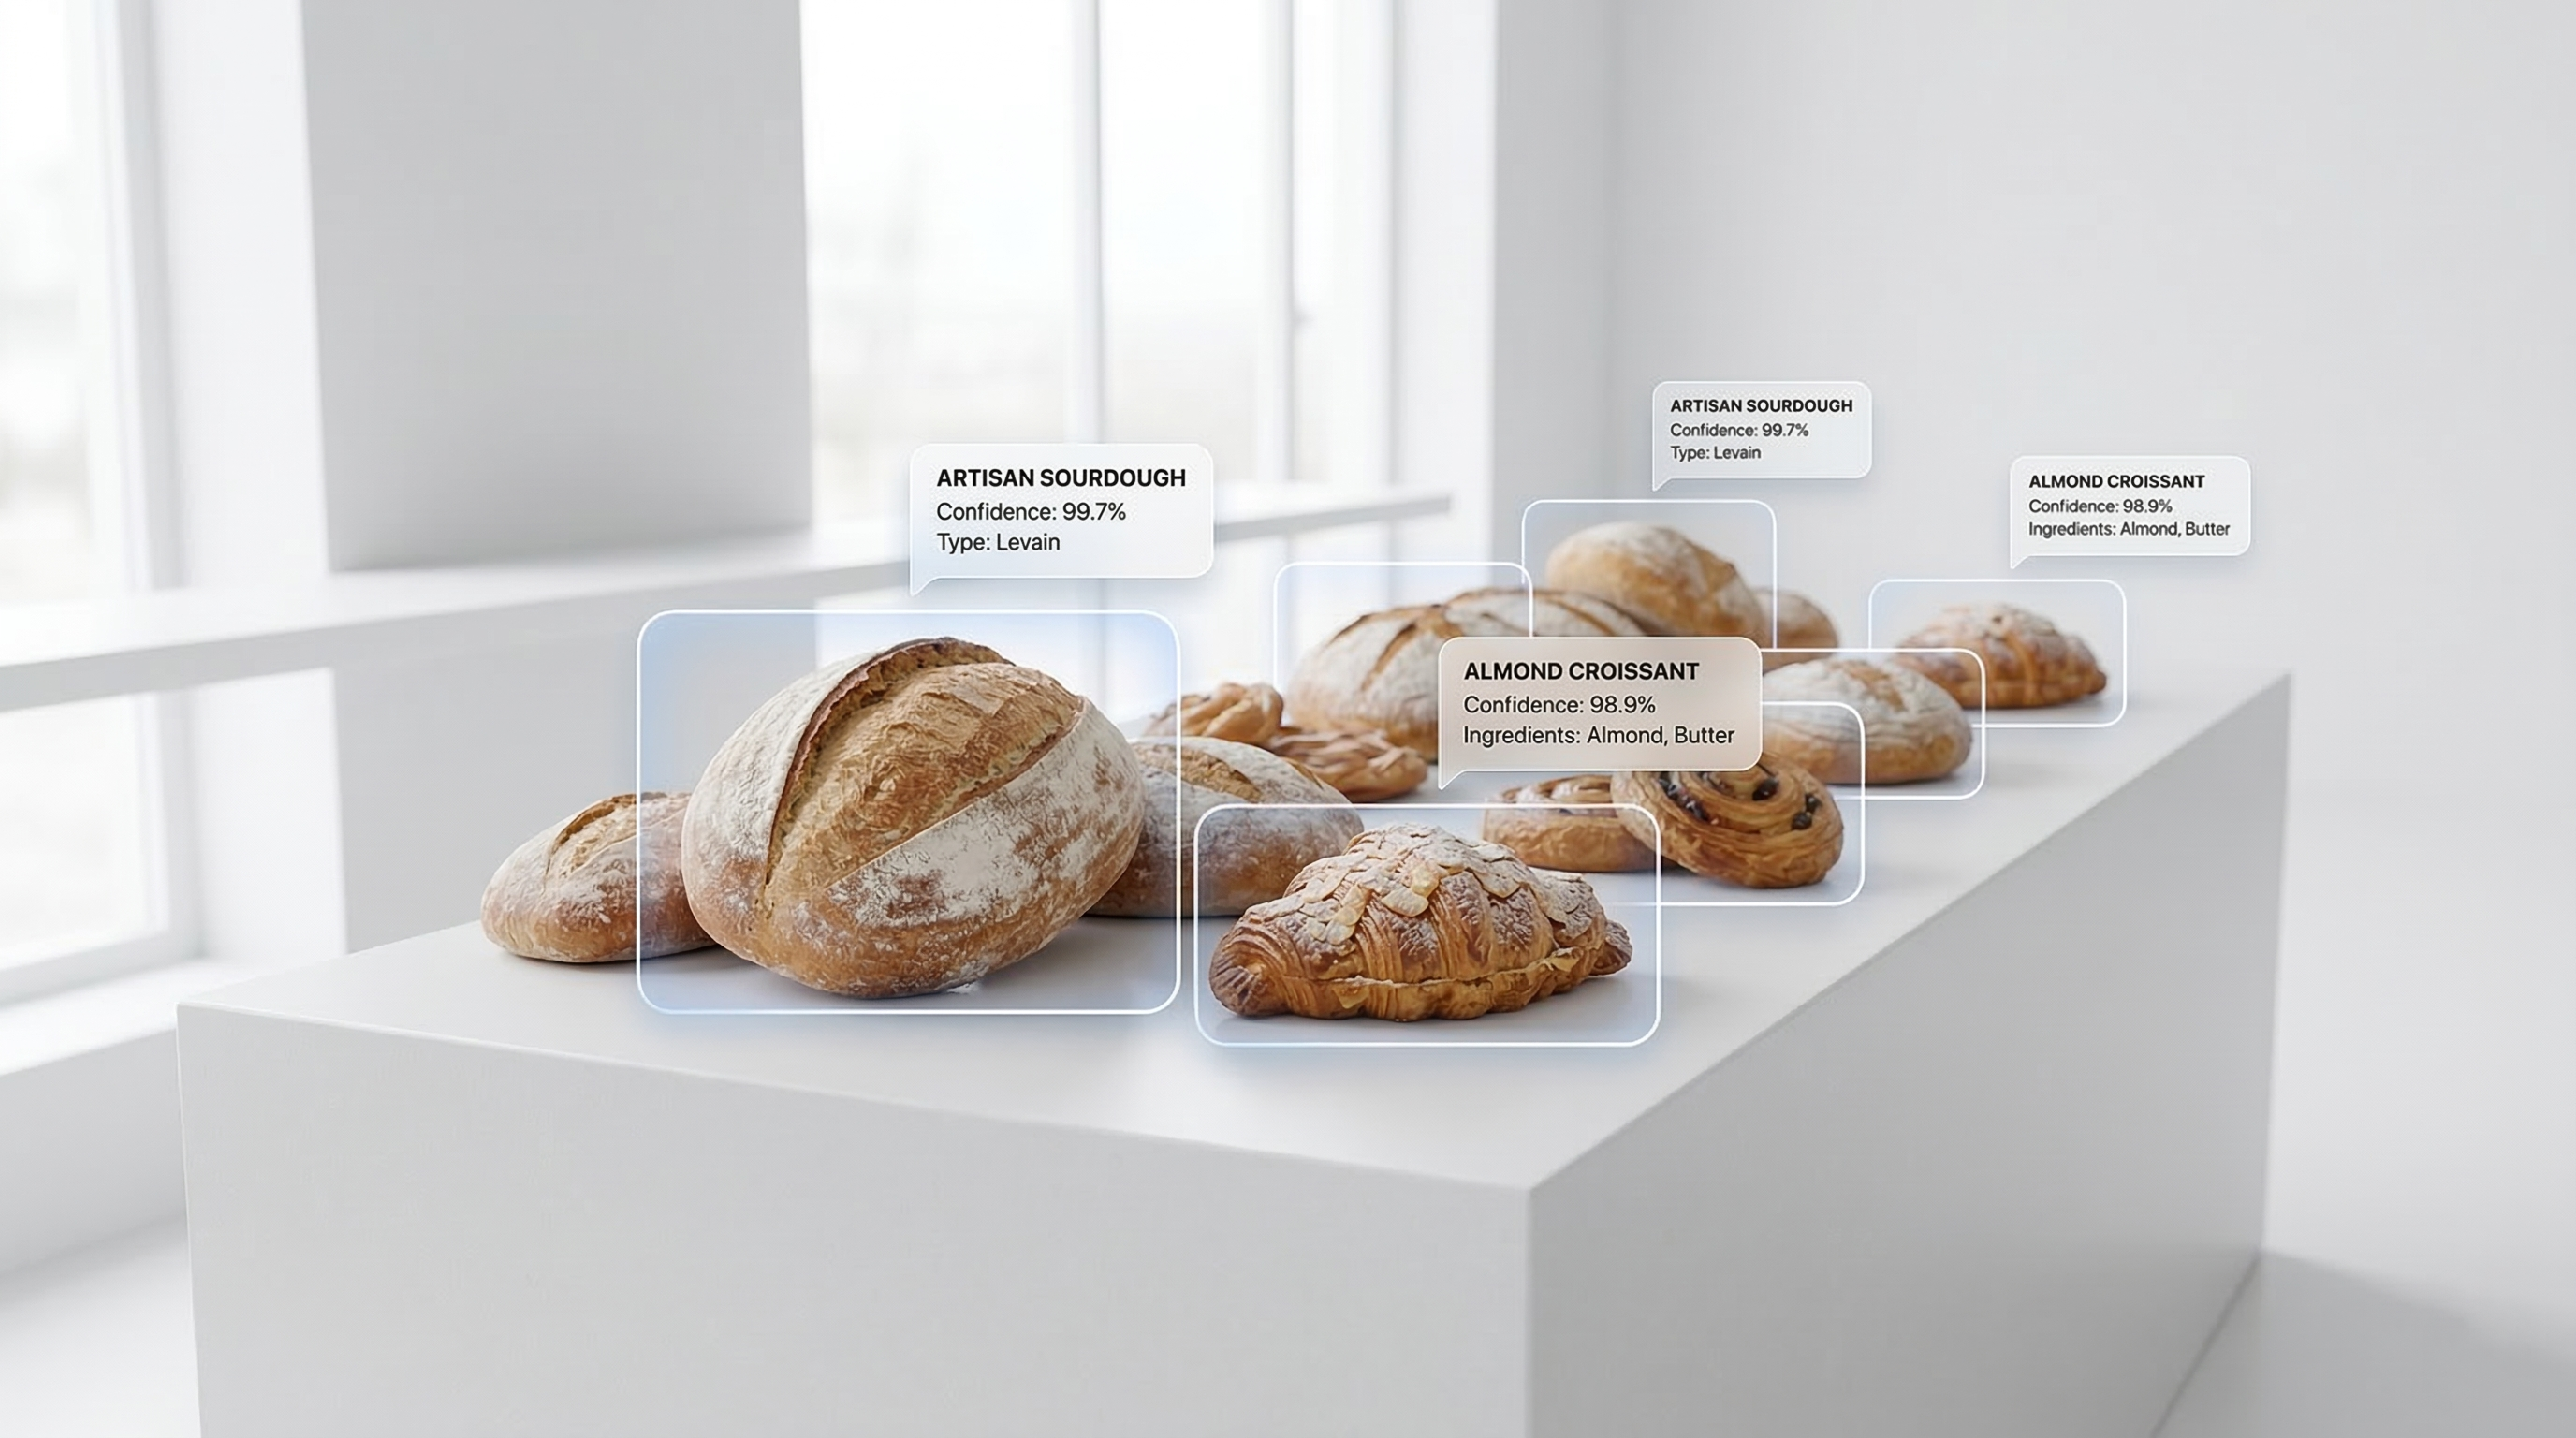
Custom vision AI processes the image
The images are instantly routed to our custom-trained Machine Learning vision model. Designed specifically for bakeries, it effortlessly recognizes overlapping artisan loaves, delicate pastries, and varying tray layouts.
Step 3
Step 3
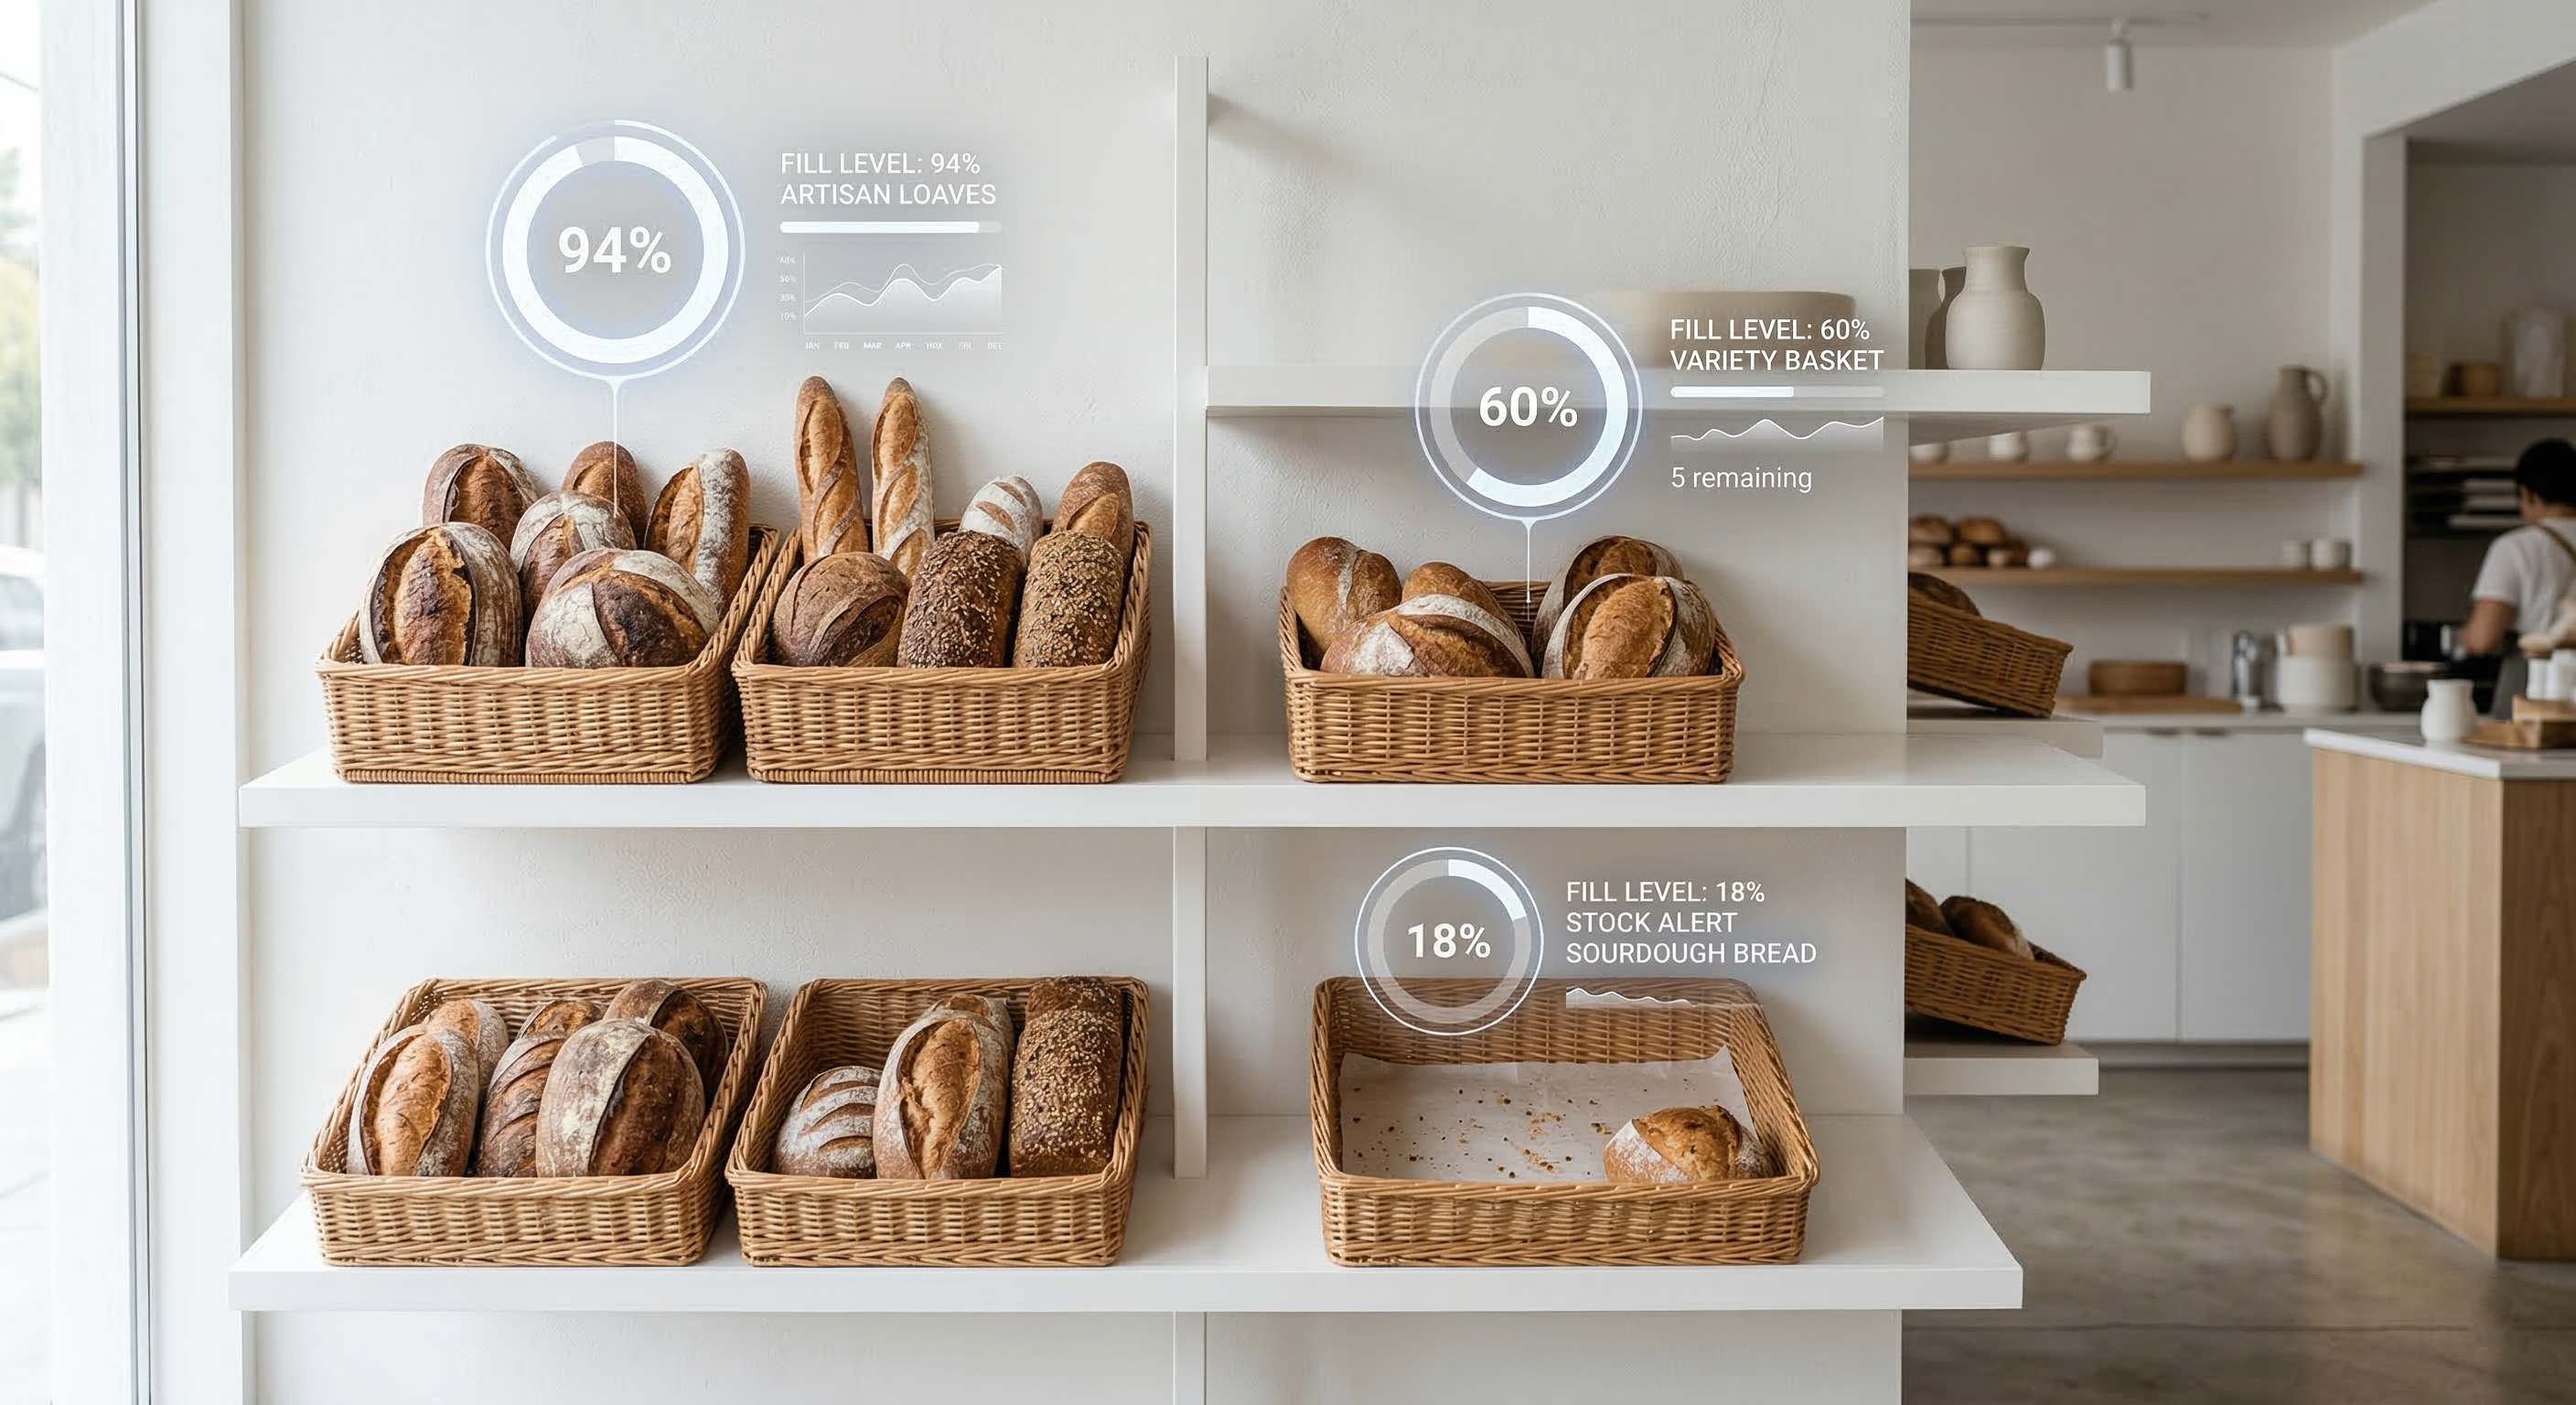
Extract precise fill ratios
The system analyzes the visual data to calculate exact fill ratios for every shelf and basket. It knows immediately what is fully stocked, what is running low, and what has sold out, with clinical precision.
Step 4
Step 4
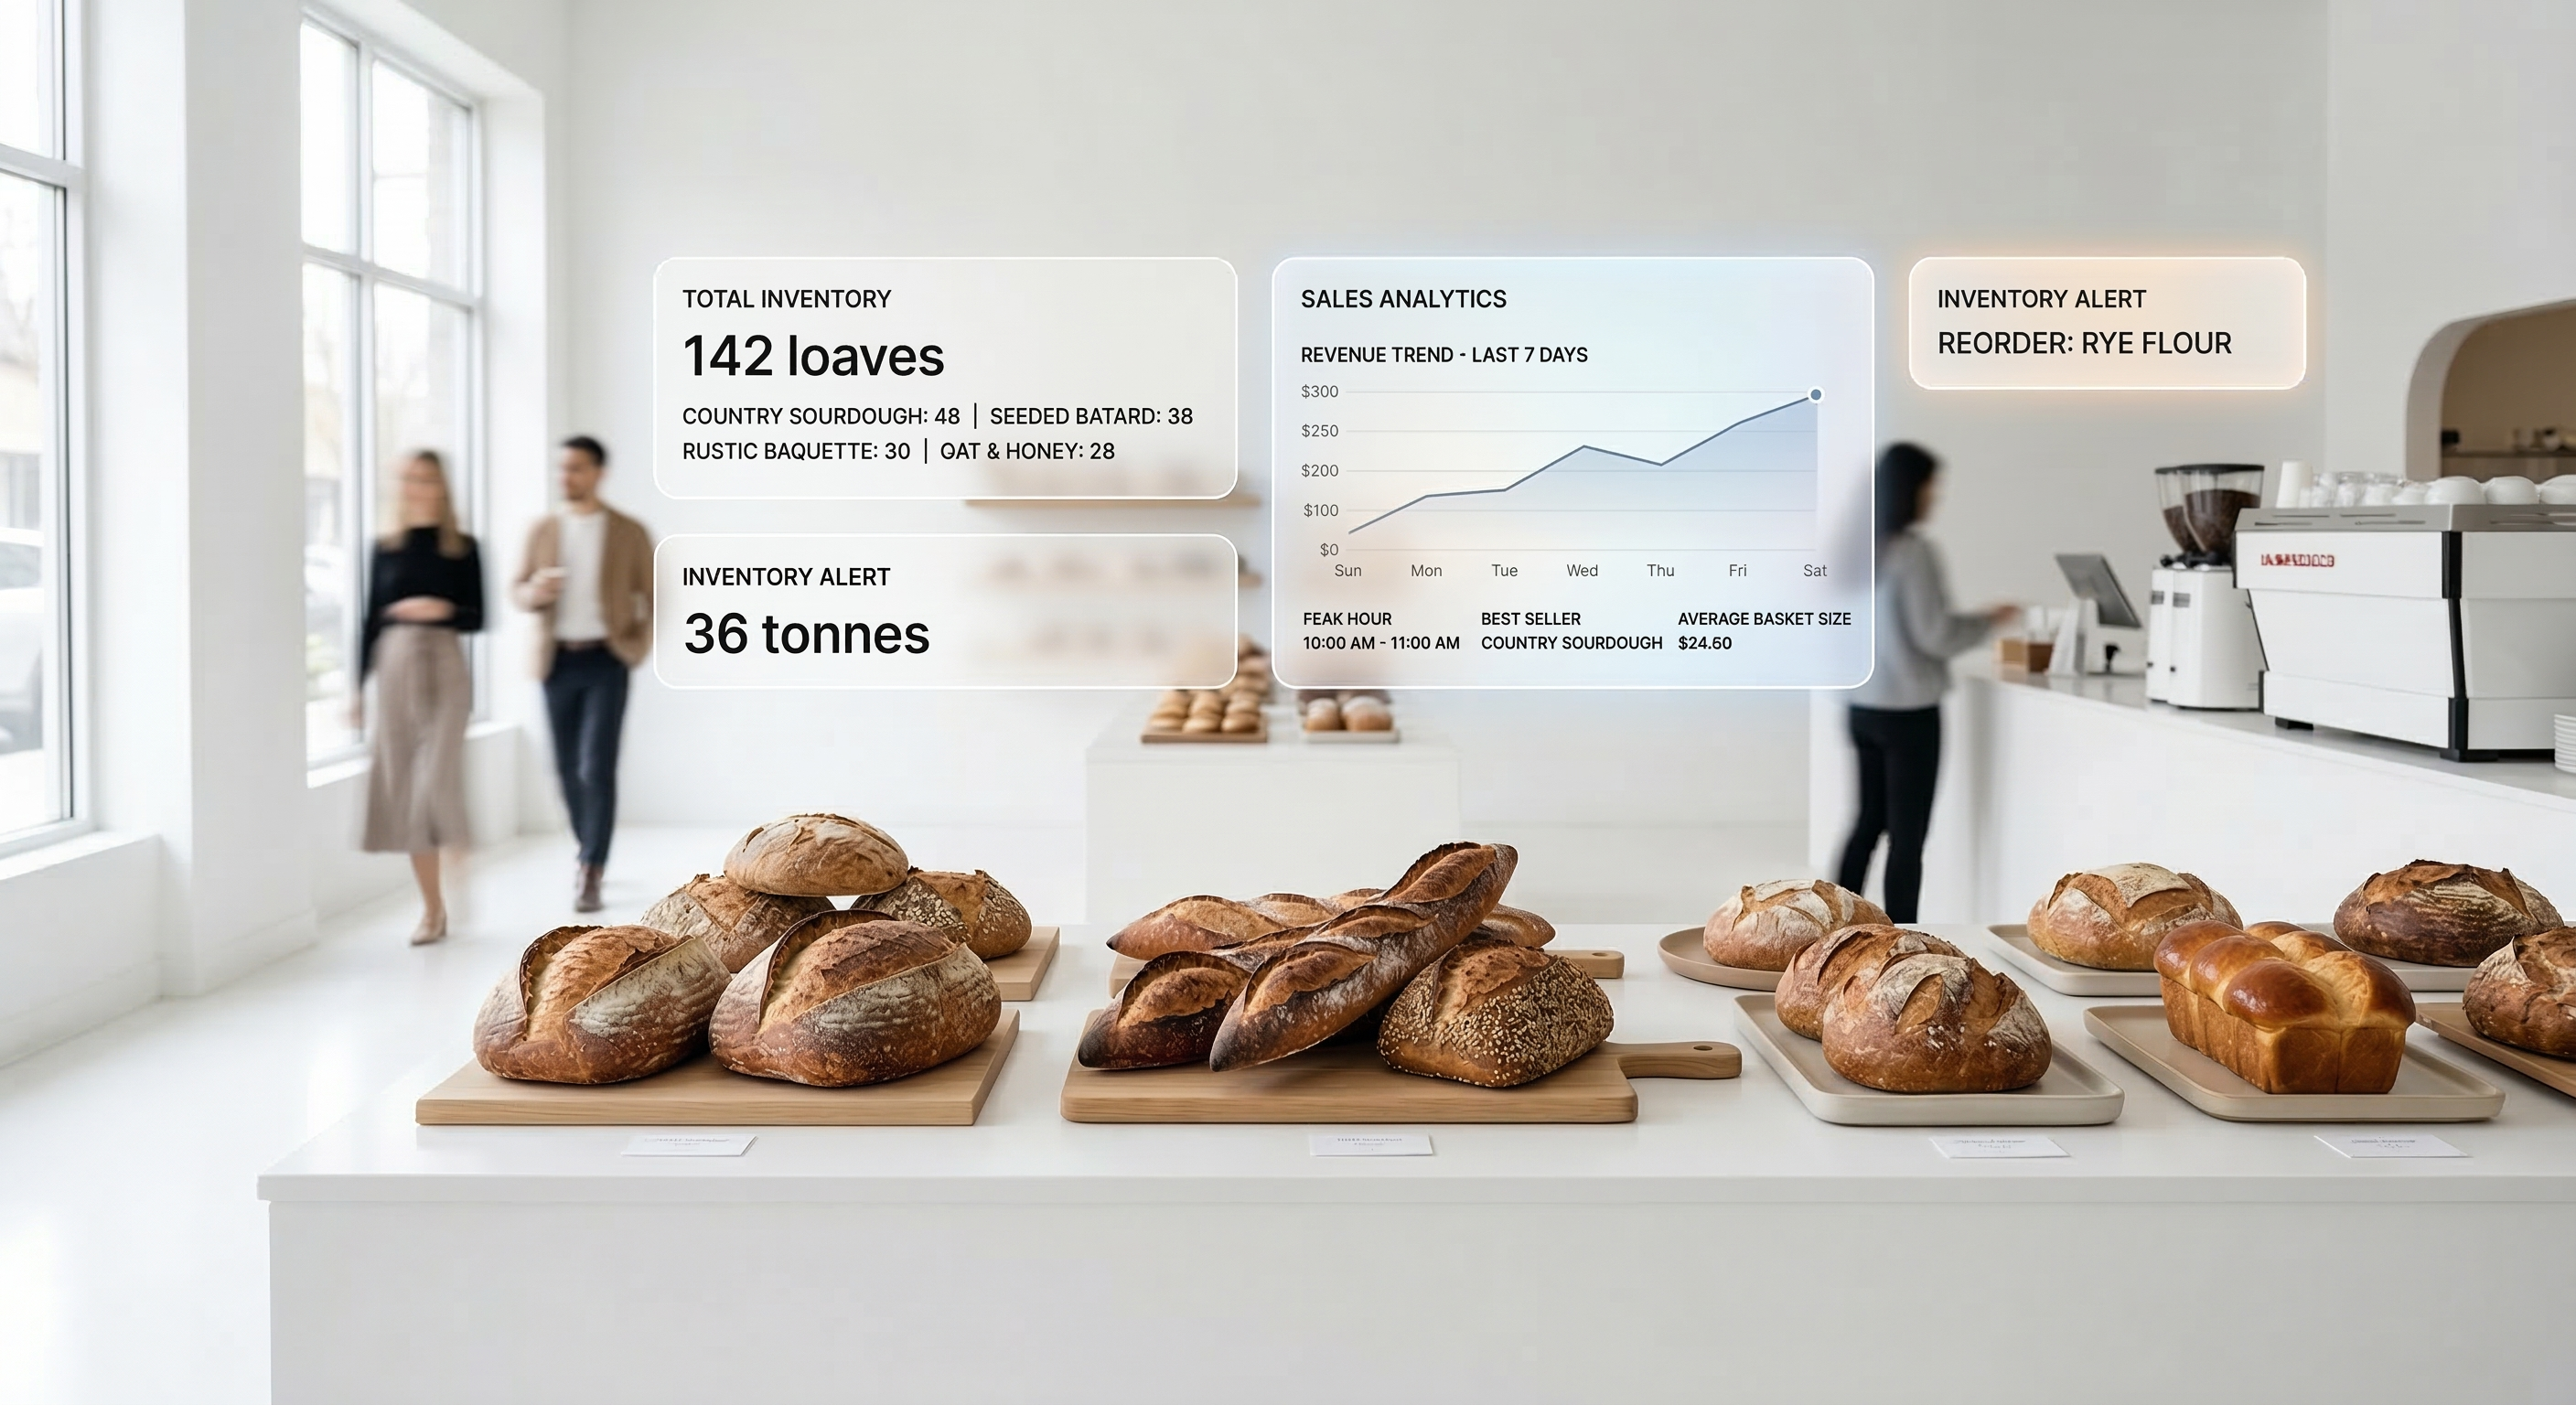
Manage everything from a sleek dashboard
All extracted data is instantly aggregated into a centralized, minimalist dashboard. Monitor real-time availability, track sales velocity, and reduce end-of-day waste without ever doing a manual count.
03/Performance
Live in weeks, accurate from day one
A custom model per vertical, trained on your real shelves - fast to deploy and precise once it is running.
Sneak peek/The platform
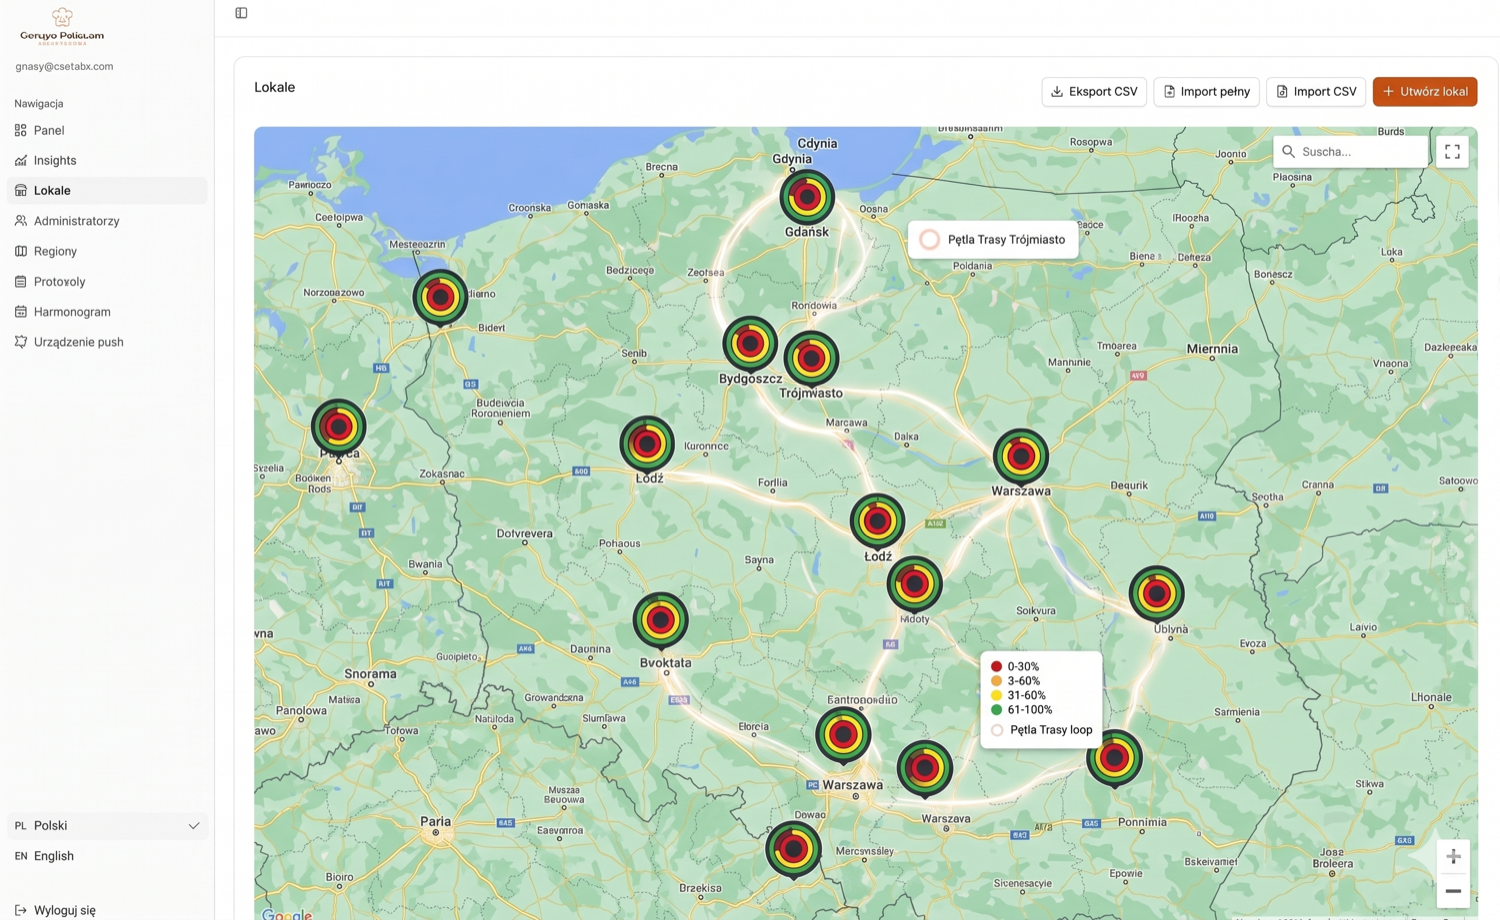
Every location, one screen.
- Every location on one live map, colour-coded by fill ratio
- Region, protocol and schedule management built in
- Full CSV import / export - plug it into what you already run
04/Privacy
Faces blurred. Always.
Auditing the physical world means people walk into frame. They never make it into your data - every face is blurred before a photo is processed.
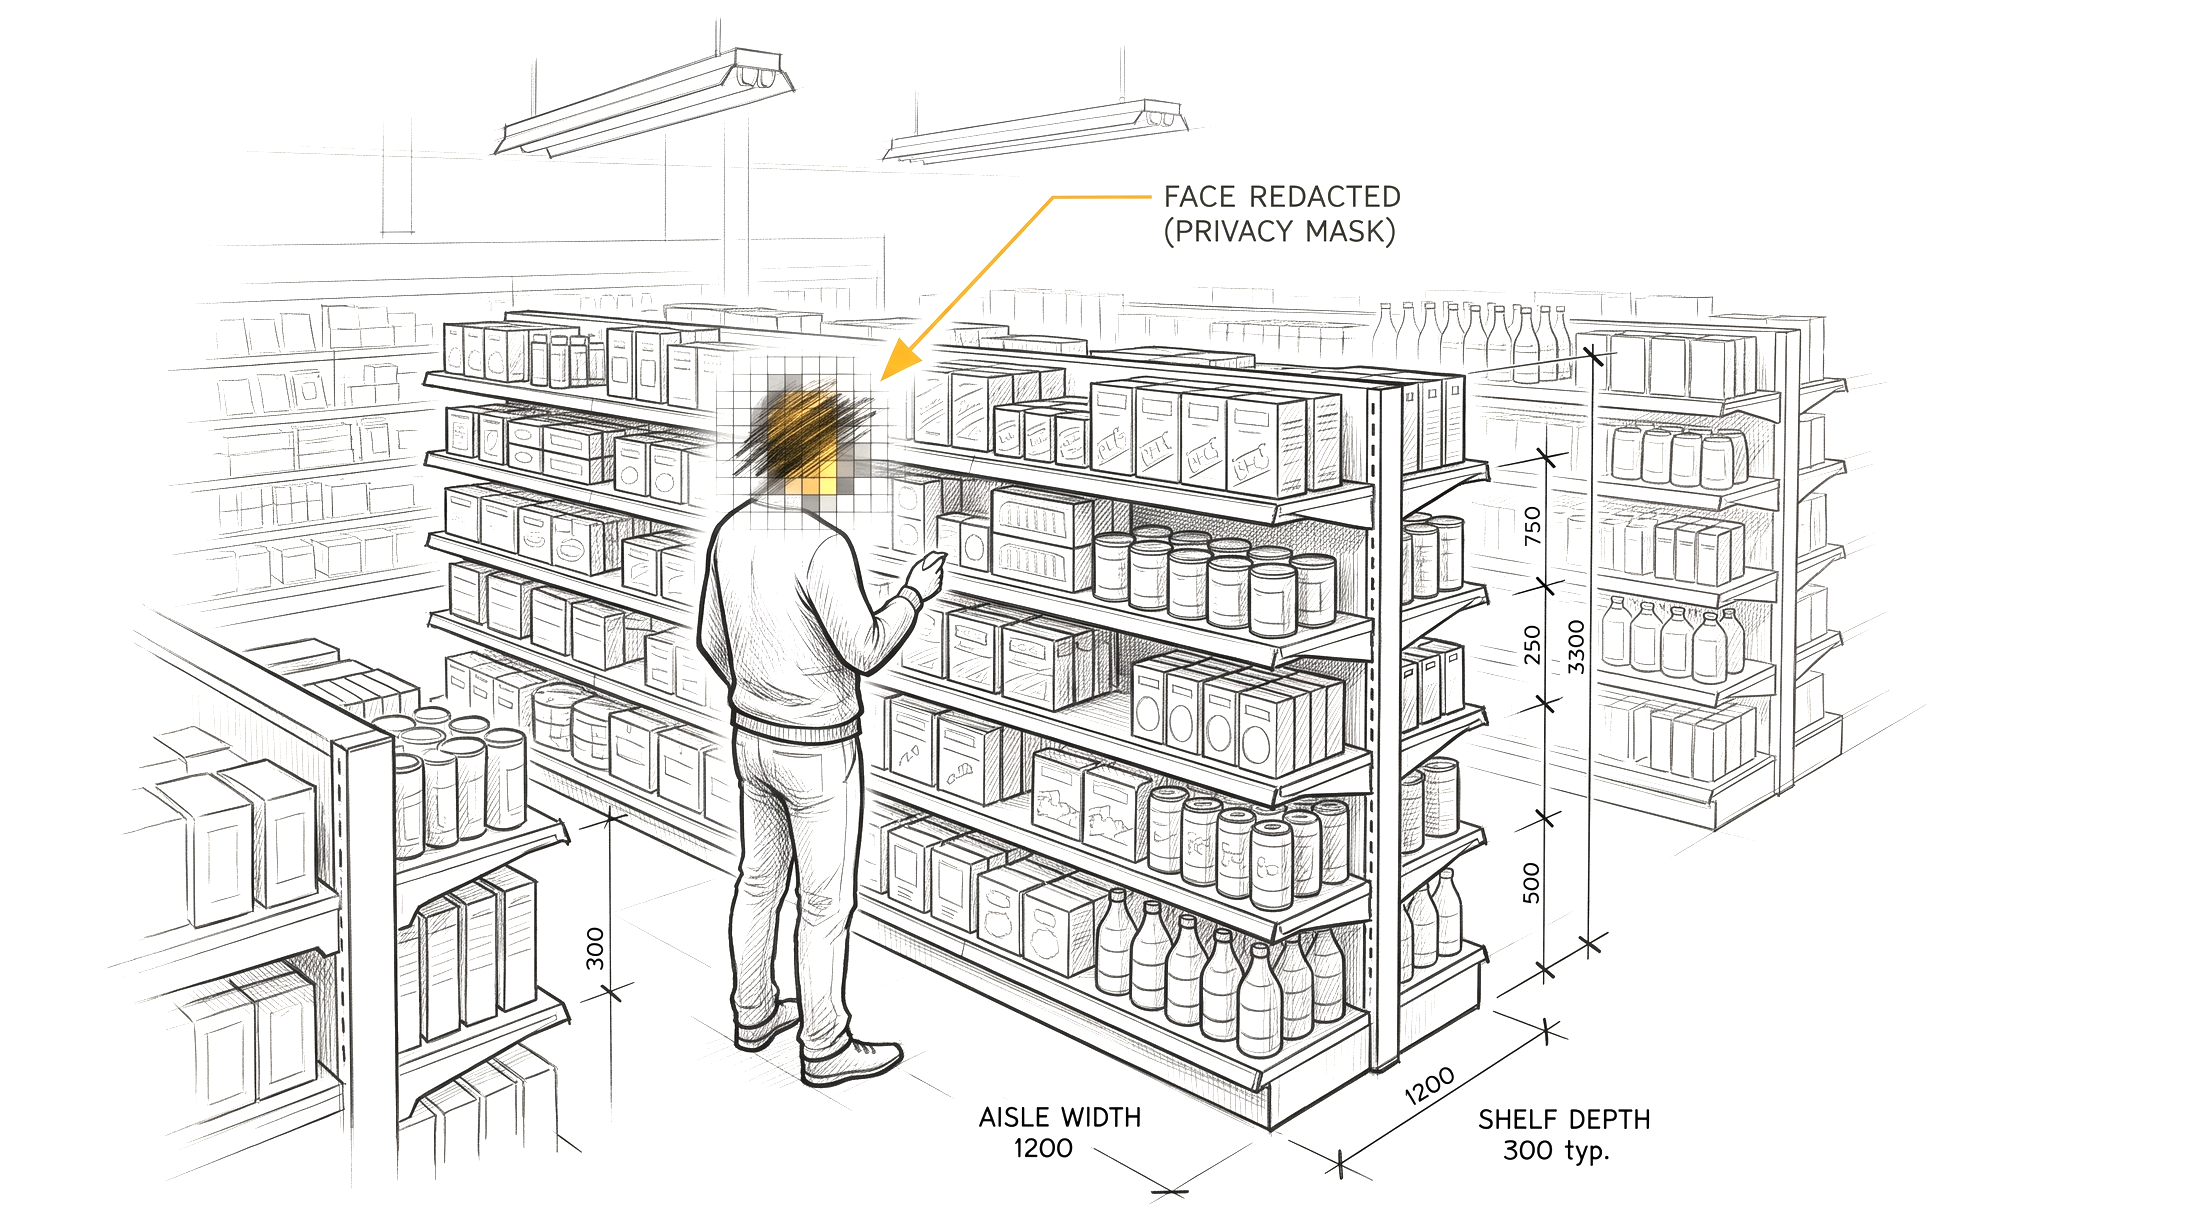
Faces blurred on capture
Every photo passes through a face-detection and blur step before it is ever stored or analysed.
We read shelves, not people
Our models are trained on inventory geometry - fill ratios and product shapes - never on identities.
No biometric data, ever
We never extract, match, or retain facial features. There is nothing to leak.
Processed in the 🇪🇺
Built and hosted in Europe, GDPR-compliant by design.
RetailRetailrunsrunsononwhatwhatyouyoucan'tcan'tsee.see.ASAIASAILabsLabsmakesmakeseveryeveryshelf,shelf,countercounterandanddisplaydisplaycountable,countable,comparablecomparableandandaudit-ready.audit-ready.
05/FAQ
Everything you need to know
The essentials before you install.